












Chaos Testing KubeDB Managed Elasticsearch with Chaos-Mesh
New to KubeDB? Please start here .
Elasticsearch is a distributed search and analytics engine that spreads your data across shards, replicates those shards for redundancy, and elects a master node to manage cluster state. Each of those mechanisms is a promise: a replica will take over if a primary shard dies, a new master will be elected if the current one fails, and the cluster will tell you — via its green / yellow / red health color — exactly how safe your data is at any moment.
The only way to trust those promises is to break the cluster on purpose. In this blog we deploy a dedicated master / data / ingest Elasticsearch topology with KubeDB and subject its master nodes, its data nodes holding primary shards, its network, its disks, and its clock to 21 controlled chaos experiments with Chaos Mesh — measuring master re-election time, health-color transitions, replica-shard promotion, indexing/search availability, and acknowledged-write data loss for every one.
Setup Cluster
To follow along with this tutorial, you will need:
- A running Kubernetes cluster.
- KubeDB installed in your cluster.
- kubectl command-line tool configured to communicate with your cluster.
- Chaos-Mesh installed
in your cluster.
helm upgrade -i chaos-mesh chaos-mesh/chaos-mesh \
 -n chaos-mesh \
--create-namespace \
--set dashboard.create=true \
--set dashboard.securityMode=false \
--set chaosDaemon.runtime=containerd \
--set chaosDaemon.socketPath=/run/containerd/containerd.sock \
--set chaosDaemon.privileged=true
Note: Make sure to set the correct path to your container runtime socket and runtime in the above command. For ex:
socketPath=/run/containerd/containerd.sock, or if in k3s, setchaosDaemon.socketPath=/run/k3s/containerd/containerd.sock.
dashboard.securityMode=falsedisables dashboard authentication and is only safe on a throwaway/dev cluster with no external access. For anything else, leave security mode on and follow the production installation guide to set up dashboard RBAC/auth instead.
Verify KubeDB and Chaos-Mesh Installation
➤ kubectl get pods -n kubedb
NAME                                            READY   STATUS    RESTARTS     AGE
kubedb-kubedb-autoscaler-0                      1/1     Running   0            8d
kubedb-kubedb-gitops-0                          1/1     Running   0            8d
kubedb-kubedb-ops-manager-0                     1/1     Running   1 (8d ago)   8d
kubedb-kubedb-provisioner-0                     1/1     Running   0            9h
kubedb-kubedb-webhook-server-79877bbc55-qkh6b   1/1     Running   0            9h
kubedb-petset-86d9f5f74-m688x                   1/1     Running   0            9h
kubedb-sidekick-8769d7b7d-zbmx6                 1/1     Running   0            9h
kubedb-supervisor-7dbdfff6f4-fh6fg              1/1     Running   0            9h
➤ kubectl get pods -n chaos-mesh
NAME                                       READY   STATUS    RESTARTS   AGE
chaos-controller-manager-68b74f685-gfbqf   1/1     Running   0          14h
chaos-controller-manager-68b74f685-l4mq6   1/1     Running   0          14h
chaos-controller-manager-68b74f685-v6m9x   1/1     Running   0          14h
chaos-daemon-jctbw                         1/1     Running   0          14h
chaos-dashboard-65d88d569-vzwpr            1/1     Running   0          14h
chaos-dns-server-66f4d96586-4dm2h          1/1     Running   0          14h
Introduction to Chaos Engineering
Chaos Engineering is a disciplined approach to testing distributed systems by deliberately introducing controlled failure scenarios to discover vulnerabilities and weaknesses before they impact your users. Rather than waiting for production incidents, chaos engineering proactively identifies how your system behaves under adverse conditions—such as pod failures, network outages, resource exhaustion, and data corruption.
This methodology is particularly crucial for database systems, where failures can lead to data loss, service downtime, and compromised data consistency. Elasticsearch adds an extra dimension: because your data is sharded and replicated across many nodes, “failure” is rarely all-or-nothing. Instead the cluster degrades gracefully through health colors — green (all shards allocated), yellow (all primaries allocated, some replicas missing), and red (a primary shard is unavailable) — while it promotes replicas and reallocates shards behind the scenes.
What This Blog Covers
In this comprehensive guide, we will:
- Deploy a Highly Available Elasticsearch Cluster on Kubernetes using KubeDB, with a dedicated 3 master / 3 data / 2 ingest topology.
- Run 21 Chaos Engineering Experiments using Chaos-Mesh to simulate real-world failure scenarios — master kills, data-node loss, OOM, network partitions, packet loss/corruption, resource stress, clock skew, and disk I/O faults.
- Observe Cluster Behavior during failures: master re-election, cluster health transitions, replica-shard promotion, and shard reallocation.
- Measure Resilience by tracking re-election/recovery time and — using a continuous index/search load client — every acknowledged document, so we can prove whether any were lost.
- Learn Best Practices for running a resilient Elasticsearch cluster and understand the data-safety vs. availability trade-offs behind the yellow and red cluster states.
You can see the Chaos Testing Results Summary
for a quick view of what we have done in this blog.
Elasticsearch Cluster Key Concepts
Before we start breaking things, it helps to understand how an Elasticsearch cluster is put together and what “failover” means for each part.
- Node roles. In a topology cluster, KubeDB runs three kinds of nodes:
- master nodes manage cluster state (which shards live where) and elect one elected master. They hold no data.
- data nodes store the shards and do the indexing and search work.
- ingest / coordinating nodes pre-process documents and route client requests; they hold no shards.
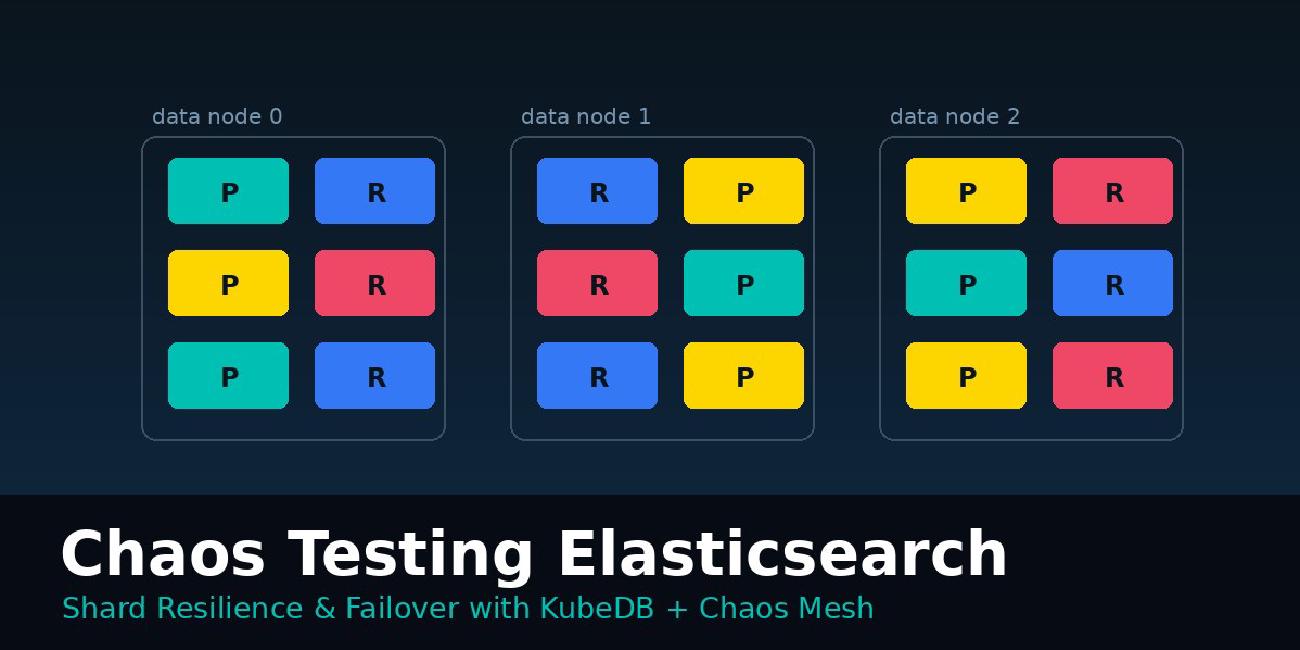
- Shards and replicas. An index is split into primary shards; each primary can have one or more replica shards on other data nodes. A write is acknowledged only after it reaches the primary and its in-sync replicas. If a data node dies, Elasticsearch promotes a replica to primary so the data stays available.
- Master election & quorum. The master-eligible nodes elect a leader using a quorum of
⌊N/2⌋ + 1. With 3 master nodes the quorum is 2, so the cluster tolerates the loss of one master and still avoids split-brain — a minority of masters will never elect a competing leader. - Cluster health colors:
- green — every primary and every replica shard is allocated.
- yellow — every primary is allocated, but one or more replicas are missing (still fully available, just less redundant).
- red — at least one primary shard is unavailable (some data cannot be read or written).
- Failover. Killing a master triggers a master re-election but does not touch your data. Killing a data node triggers replica promotion (green → yellow) and, once the node returns or shards reallocate, a return to green.
Because the elected master is dynamic, we ask Elasticsearch who it is rather than guessing:
kubectl exec -n demo es-tools -- curl -s -k -u "$USER:$PASS" \
  "https://es-ha-cluster.demo.svc.cluster.local:9200/_cat/master?h=node"
Create a High-Availability Elasticsearch Cluster
Save the following as es-cluster.yaml. It provisions a dedicated topology of 3 master, 3 data, and 2 ingest nodes with per-node durable storage and TLS enabled. We set deletionPolicy: Delete so the PVCs are cleaned up when the cluster is deleted.
apiVersion: kubedb.com/v1
kind: Elasticsearch
metadata:
  name: es-ha-cluster
  namespace: demo
spec:
  enableSSL: true
  version: xpack-8.18.8
  storageType: Durable
  topology:
    master:
      suffix: master
      replicas: 3
      podTemplate:
        spec:
          containers:
            - name: elasticsearch
              resources:
                requests: { cpu: 500m, memory: 1Gi }
                limits: { memory: 1Gi }
      storage:
        storageClassName: "local-path"
        accessModes: [ReadWriteOnce]
        resources:
          requests:
            storage: 2Gi
    data:
      suffix: data
      replicas: 3
      podTemplate:
        spec:
          containers:
            - name: elasticsearch
              resources:
                requests: { cpu: 500m, memory: 1536Mi }
                limits: { memory: 1536Mi }
      storage:
        storageClassName: "local-path"
        accessModes: [ReadWriteOnce]
        resources:
          requests:
            storage: 4Gi
    ingest:
      suffix: ingest
      replicas: 2
      podTemplate:
        spec:
          containers:
            - name: elasticsearch
              resources:
                requests: { cpu: 500m, memory: 1Gi }
                limits: { memory: 1Gi }
      storage:
        storageClassName: "local-path"
        accessModes: [ReadWriteOnce]
        resources:
          requests:
            storage: 2Gi
  deletionPolicy: Delete
Create the namespace and apply:
kubectl create ns demo
kubectl apply -f es-cluster.yaml
Wait for the cluster to become Ready:
➤ kubectl get elasticsearch.kubedb.com -n demo -w
NAME            VERSION        STATUS   AGE
es-ha-cluster   xpack-8.18.8   Ready    6m
All eight pods come up across the three StatefulSets:
➤ kubectl get pods -n demo -l app.kubernetes.io/instance=es-ha-cluster
NAME                     READY   STATUS    RESTARTS   AGE
es-ha-cluster-data-0     1/1     Running   0          6m
es-ha-cluster-data-1     1/1     Running   0          6m
es-ha-cluster-data-2     1/1     Running   0          6m
es-ha-cluster-ingest-0   1/1     Running   0          6m
es-ha-cluster-ingest-1   1/1     Running   0          6m
es-ha-cluster-master-0   1/1     Running   0          6m
es-ha-cluster-master-1   1/1     Running   0          6m
es-ha-cluster-master-2   1/1     Running   0          6m
Grab the admin credentials and check the cluster health and node roles. For convenience we run a small curl helper pod (es-tools) inside the namespace:
➤ kubectl run es-tools -n demo --image=curlimages/curl:8.11.1 --command -- sleep infinity
➤ PASS=$(kubectl get secret -n demo es-ha-cluster-auth -o jsonpath='{.data.password}' | base64 -d)
➤ USER=$(kubectl get secret -n demo es-ha-cluster-auth -o jsonpath='{.data.username}' | base64 -d)

➤ kubectl exec -n demo es-tools -- curl -s -k -u "$USER:$PASS" \
    "https://es-ha-cluster.demo.svc.cluster.local:9200/_cluster/health?pretty"
{
  "cluster_name" : "es-ha-cluster",
  "status" : "green",
  "number_of_nodes" : 8,
  "number_of_data_nodes" : 3,
  "active_primary_shards" : 4,
  "active_shards" : 8,
  "unassigned_shards" : 0,
  "active_shards_percent_as_number" : 100.0
}
➤ kubectl exec -n demo es-tools -- curl -s -k -u "$USER:$PASS" \
    "https://es-ha-cluster.demo.svc.cluster.local:9200/_cat/nodes?v&h=name,node.role,master"
name                   node.role master
es-ha-cluster-master-2 m         -
es-ha-cluster-master-0 m         -
es-ha-cluster-data-0   d         -
es-ha-cluster-ingest-1 i         -
es-ha-cluster-ingest-0 i         -
es-ha-cluster-data-1   d         -
es-ha-cluster-data-2   d         -
es-ha-cluster-master-1 m         *
The * marks the elected master — here es-ha-cluster-master-1. The three m nodes are master-eligible, the d nodes hold data, and the i nodes are ingest/coordinating.
Chaos Testing
Elasticsearch Continuous Index/Search Load Client
To measure data loss we need something writing to the cluster continuously and keeping an independent count of what it believes it committed. We package a small load client (a curl-based Job) that:
- creates an index
chaos-loadwith 3 primary shards and 1 replica each, so every shard has a copy that can be promoted, - bulk-indexes 100 documents per request with explicit
_ids (so a retry after an ambiguous failure is idempotent — it overwrites rather than duplicates), - increments a client-side
committedcounter only when Elasticsearch acknowledges the bulk with"errors":false, - periodically searches the index back, and
- at the end compares
client_committedagainst the actual document count.
If the index ever ends up with fewer documents than the client counted as committed, we have lost an acknowledged write. It reuses the KubeDB-generated es-ha-cluster-auth secret for credentials.
Save this as k8s/01-configmap.yaml:
apiVersion: v1
kind: ConfigMap
metadata:
  name: es-load-test-config
  namespace: demo
  labels:
    app: es-load-test
data:
  TEST_RUN_DURATION: "100000"
  BATCH_SIZE: "100"
  REPORT_INTERVAL: "10"
  INDEX: "chaos-load"
  ES_URL: "https://es-ha-cluster.demo.svc.cluster.local:9200"
  load.sh: |
    #!/bin/sh
    URL="${ES_URL}"; USER="${ES_USER}"; PASS="${ES_PASS}"
    INDEX="${INDEX:-chaos-load}"; BATCH="${BATCH_SIZE:-100}"
    DURATION="${TEST_RUN_DURATION:-3600}"; REPORT="${REPORT_INTERVAL:-10}"
    c() { curl -s -k -u "${USER}:${PASS}" "$@"; }
    committed=0; idx_ok=0; idx_fail=0; search_ok=0; search_fail=0
    start=$(date +%s); last_report=$start
    until c "${URL}/_cluster/health" | grep -qE '"status":"(green|yellow)"'; do sleep 3; done
    c -X PUT "${URL}/${INDEX}" -H 'Content-Type: application/json' \
      -d '{"settings":{"number_of_shards":3,"number_of_replicas":1,"index.write.wait_for_active_shards":"1"}}' >/dev/null
    while [ $(( $(date +%s) - start )) -lt "$DURATION" ]; do
      ts=$(date -u +%FT%TZ); i=$committed; end=$(( committed + BATCH )); : > /tmp/bulk
      while [ $i -lt $end ]; do
        printf '{"index":{"_id":"%s"}}\n{"n":%s,"ts":"%s","pad":"chaos-load-doc"}\n' "$i" "$i" "$ts" >> /tmp/bulk
        i=$(( i + 1 ))
      done
      resp=$(c -X POST "${URL}/${INDEX}/_bulk" -H 'Content-Type: application/x-ndjson' --data-binary @/tmp/bulk)
      if echo "$resp" | grep -q '"errors":false'; then
        committed=$(( committed + BATCH )); idx_ok=$(( idx_ok + 1 ))
      else idx_fail=$(( idx_fail + 1 )); sleep 0.3; fi
      if [ $(( (idx_ok + idx_fail) % 5 )) -eq 0 ]; then
        if c "${URL}/${INDEX}/_search?size=0&q=*:*" | grep -q '"total"'; then
          search_ok=$(( search_ok + 1 )); else search_fail=$(( search_fail + 1 )); fi
      fi
      now=$(date +%s)
      if [ $(( now - last_report )) -ge "$REPORT" ]; then
        elapsed=$(( now - start )); rate=0; [ $elapsed -gt 0 ] && rate=$(( committed / elapsed ))
        health=$(c "${URL}/_cluster/health" | sed -n 's/.*"status":"\([a-z]*\)".*/\1/p')
        echo "$(date -u +%FT%TZ) [report] elapsed=${elapsed}s committed_docs=${committed} idx_ok=${idx_ok} idx_fail=${idx_fail} search_ok=${search_ok} search_fail=${search_fail} health=${health} rate=${rate}b/s"
        last_report=$now
      fi
    done
    actual=$(c "${URL}/${INDEX}/_count" | sed -n 's/.*"count":\([0-9]*\).*/\1/p')
    echo "$(date -u +%FT%TZ) [verify] client_committed=${committed} db_actual=${actual}"
The accompanying Job (k8s/03-job.yaml) runs the script on the curlimages/curl image, pulling the ES credentials from the es-ha-cluster-auth secret. Deploy and confirm it is indexing:
➤ kubectl apply -f k8s/01-configmap.yaml
➤ kubectl apply -f k8s/03-job.yaml

➤ kubectl logs -n demo -l app=es-load-test --tail=2
2026-07-22T08:46:41Z [load] index ready, beginning load
2026-07-22T08:46:51Z [report] elapsed=10s committed_docs=26000 idx_ok=260 idx_fail=0 search_ok=52 search_fail=0 health=green rate=2600b/s
The client sustains roughly 2,600–3,100 documents indexed per second on this small cluster. With the load running, we can start the chaos.
Two helpers we reuse throughout:
master.shprints the elected master via_cat/master, andmeasure_green.shpolls_cluster/healthand reports how long the cluster took to return to green.
Chaos#1: Kill the Elected Master
The most fundamental Elasticsearch failover: the elected master disappears. With three master-eligible nodes, the remaining two form a quorum and elect a new master almost instantly.
Save this as tests/01-master-pod-kill.yaml:
apiVersion: chaos-mesh.org/v1alpha1
kind: PodChaos
metadata:
  name: es-master-pod-kill
  namespace: chaos-mesh
spec:
  action: pod-kill
  mode: one
  selector:
    namespaces:
      - demo
    labelSelectors:
      "statefulset.kubernetes.io/pod-name": "es-ha-cluster-master-1"
  gracePeriod: 0
  duration: "30s"
What this chaos does: Terminates the elected master pod abruptly, forcing a master re-election.
➤ ./master.sh
es-ha-cluster-master-1

➤ kubectl apply -f tests/01-master-pod-kill.yaml
➤ ./measure_master.sh es-ha-cluster-master-1 90
ELAPSED=1s NEW_MASTER=es-ha-cluster-master-2
A new master was elected in ~1 second, and — critically — the cluster health never left green, because master nodes hold no shards. The load client kept indexing at ~3,100 docs/s with zero failures:
2026-07-22T08:47:31Z [report] elapsed=50s committed_docs=157800 idx_ok=1578 idx_fail=0 search_ok=315 search_fail=0 health=green rate=3156b/s
Result: Master re-election ~1s, health stayed green, quorum preserved, 0 data loss.
Chaos#2: Kill a Data Node Holding Primary Shards
Now we kill a data node. This is where replica promotion and the yellow health state come into play.
➤ curl .../_cat/shards/chaos-load?h=shard,prirep,state,node
1 p STARTED es-ha-cluster-data-0     # data-0 holds a primary...
2 r STARTED es-ha-cluster-data-0     # ...and a replica
Save as tests/02-data-pod-kill.yaml:
apiVersion: chaos-mesh.org/v1alpha1
kind: PodChaos
metadata:
  name: es-data-pod-kill
  namespace: chaos-mesh
spec:
  action: pod-kill
  mode: one
  selector:
    namespaces:
      - demo
    labelSelectors:
      "statefulset.kubernetes.io/pod-name": "es-ha-cluster-data-0"
  gracePeriod: 0
  duration: "30s"
What this chaos does: Kills a data node that holds a primary shard, forcing Elasticsearch to promote a replica.
➤ kubectl apply -f tests/02-data-pod-kill.yaml
health before=green
t+2 health=yellow                    # primary lost -> replica promoted, replicas now missing
...
GREEN_ELAPSED=4s                      # replica promoted & reallocated, back to green
The cluster dropped to yellow the moment data-0 died (its primary shard’s replica was instantly promoted, but the cluster was now short a replica), then returned to green in ~4 seconds as shards reallocated and the node restarted. The load client logged a brief burst of failed bulk requests as the shard moved (idx_fail climbed by a few dozen) but committed_docs kept rising the whole time — the promoted replica kept the index writable:
2026-07-22T08:48:11Z [report] elapsed=90s  committed_docs=265900 idx_ok=2659 idx_fail=19 ...
2026-07-22T08:48:21Z [report] elapsed=100s committed_docs=273000 idx_ok=2730 idx_fail=42 ... health=yellow
Result: green → yellow → green in ~4s via replica promotion, brief indexing hiccup, 0 data loss.
Chaos#3: OOMKill a Data Node
Here we exhaust a data node’s memory to trigger a kernel OOMKill.
Save as tests/03-data-oom.yaml:
apiVersion: chaos-mesh.org/v1alpha1
kind: StressChaos
metadata:
  name: es-data-oom
  namespace: chaos-mesh
spec:
  mode: one
  selector:
    pods:
      demo:
        - es-ha-cluster-data-1
  stressors:
    memory:
      workers: 4
      size: "3GB"
  duration: "60s"
What this chaos does: Allocates 3 GB in a data node whose limit is 1.5 Gi, so the kernel OOM-kills the elasticsearch container.
➤ kubectl apply -f tests/03-data-oom.yaml
t=2 health=yellow
t=5 health=yellow
t=6 health=green
➤ kubectl get pod -n demo es-ha-cluster-data-1 -o jsonpath='restarts={...restartCount} last={...reason}'
restarts=1 last=OOMKilled
The data node’s container was OOMKilled and restarted in place. The cluster spent ~16–20 seconds yellow while the node was down and its replicas covered for it, then returned to green once it rejoined. Committed documents kept climbing throughout.
Result: Container OOMKilled and auto-restarted, green → yellow → green, 0 data loss.
Chaos#4: Kill the Elasticsearch Process in a Data Node
Instead of killing the pod, we kill just the elasticsearch container process.
Save as tests/04-data-container-kill.yaml:
apiVersion: chaos-mesh.org/v1alpha1
kind: PodChaos
metadata:
  name: es-data-container-kill
  namespace: chaos-mesh
spec:
  action: container-kill
  mode: one
  containerNames: ["elasticsearch"]
  selector:
    namespaces: [demo]
    labelSelectors:
      "statefulset.kubernetes.io/pod-name": "es-ha-cluster-data-2"
  gracePeriod: 0
  duration: "30s"
What this chaos does: Sends SIGKILL to the elasticsearch process; kubelet restarts the container in the same pod.
t=08:50:24Z health=yellow    committed_docs=654600 idx_fail=42
t=08:50:35Z health=green     committed_docs=687700 idx_fail=42
t=08:50:45Z health=green     committed_docs=720800 idx_fail=42
The cluster flicked to yellow for ~10 seconds while the container restarted, then back to green. The master was unaffected and no new indexing failures were recorded — the replicas on the other two data nodes served every request.
Result: Brief yellow (~10s) → green, master unchanged, 0 data loss.
Chaos#5: Data Node Pod Failure
pod-failure keeps the pod Running from Kubernetes’ point of view but makes the process unreachable for the duration — modelling a hung node.
Save as tests/05-data-pod-failure.yaml:
apiVersion: chaos-mesh.org/v1alpha1
kind: PodChaos
metadata:
  name: es-data-pod-failure
  namespace: chaos-mesh
spec:
  action: pod-failure
  mode: one
  selector:
    namespaces: [demo]
    labelSelectors:
      "statefulset.kubernetes.io/pod-name": "es-ha-cluster-data-0"
  duration: "60s"
What this chaos does: Makes a data node unresponsive for 60s without deleting it.
t=08:51:29Z health=yellow  committed_docs=854000  idx_fail=42
t=08:51:50Z health=yellow  committed_docs=880100  idx_fail=78
t=08:52:22Z health=green   committed_docs=1013200 idx_fail=78   # node returned
The cluster stayed yellow for the entire ~50-second pause. This is expected: Elasticsearch promotes a replica immediately to keep primaries available, but it deliberately waits (index.unassigned.node_left.delayed_timeout, default 1 minute) before reallocating the missing replicas, in case the node comes back — which it did, flipping straight back to green. Indexing continued throughout (a handful of bulk requests failed and were retried), and committed_docs never went backwards.
Result: Yellow held for the pause window, green on return, ~36 retried batches, 0 data loss.
Chaos#6: Kill an Ingest / Coordinating Node
Ingest nodes hold no shards, so killing one should be nearly invisible to cluster health.
Save as tests/06-ingest-pod-kill.yaml:
apiVersion: chaos-mesh.org/v1alpha1
kind: PodChaos
metadata:
  name: es-ingest-pod-kill
  namespace: chaos-mesh
spec:
  action: pod-kill
  mode: one
  selector:
    namespaces: [demo]
    labelSelectors:
      "statefulset.kubernetes.io/pod-name": "es-ha-cluster-ingest-0"
  gracePeriod: 0
  duration: "30s"
What this chaos does: Kills an ingest/coordinating node.
t=08:52:33Z health=green  committed_docs=1035700 idx_fail=90
t=08:52:54Z health=green  committed_docs=1073400 idx_fail=116
Cluster health stayed green throughout — no shards to reallocate. The only visible effect was a small bump in client-side failures (idx_fail 78 → 116) as a few in-flight requests that happened to be routed through the killed node had to be retried.
Result: Health stayed green, only transient client retries, 0 data loss.
Chaos#7: Network Partition the Elected Master (Split-Brain / Quorum Test)
The defining test for the master quorum. We isolate the elected master from the rest of the cluster. In a minority of one, it cannot remain master; the other two master-eligible nodes form a quorum and elect a new leader. No split-brain is possible.
Save as tests/07-master-partition.yaml:
apiVersion: chaos-mesh.org/v1alpha1
kind: NetworkChaos
metadata:
  name: es-master-partition
  namespace: chaos-mesh
spec:
  action: partition
  mode: all
  direction: both
  selector:
    pods:
      demo:
        - es-ha-cluster-master-2
  target:
    mode: all
    selector:
      labelSelectors:
        "app.kubernetes.io/instance": "es-ha-cluster"
  duration: "75s"
What this chaos does: Bidirectionally isolates the elected master from every other node in the cluster.
➤ kubectl apply -f tests/07-master-partition.yaml
➤ ./measure_master.sh es-ha-cluster-master-2 90
ELAPSED=8s NEW_MASTER=es-ha-cluster-master-0
health during=green
The two connected master nodes elected a new master (es-ha-cluster-master-0) in ~8 seconds, while the isolated node stepped down for lack of quorum. Cluster health stayed green — the data nodes and their shards were untouched — and indexing continued. When the partition healed, the old master rejoined and the cluster reconverged.
Result: Majority re-elected a master in ~8s, isolated master stepped down (no split-brain), health stayed green, 0 data loss.
Chaos#8: Network Delay (500ms) on a Data Node
Save as tests/08-data-net-delay.yaml:
apiVersion: chaos-mesh.org/v1alpha1
kind: NetworkChaos
metadata:
  name: es-data-net-delay
  namespace: chaos-mesh
spec:
  action: delay
  mode: all
  direction: to
  selector:
    pods:
      demo: [es-ha-cluster-data-1]
  delay:
    latency: "500ms"
    correlation: "50"
    jitter: "100ms"
  duration: "60s"
What this chaos does: Adds 500 ms latency to a data node’s traffic.
t=09:01:48Z health=green  committed_docs=2600900
t=09:02:31Z health=green  committed_docs=2604600   # near-stall
Health stayed green, but indexing throughput collapsed — committed_docs barely moved for the whole window (from 2,600,900 to 2,604,600, versus ~35,000 in a normal window). Elasticsearch replication is latency-sensitive: because every write must reach the delayed node’s replica before it is acknowledged, one slow node dragged down the whole index’s write rate. Full speed returned the instant the chaos was removed.
Result: No failover, throughput collapse while degraded, 0 data loss.
Chaos#9: Network Packet Loss (100%) on a Data Node
Save as tests/09-data-net-loss.yaml:
apiVersion: chaos-mesh.org/v1alpha1
kind: NetworkChaos
metadata:
  name: es-data-net-loss
  namespace: chaos-mesh
spec:
  action: loss
  mode: all
  direction: to
  selector:
    pods:
      demo: [es-ha-cluster-data-1]
  loss:
    loss: "100"
    correlation: "0"
  duration: "60s"
What this chaos does: Drops all of a data node’s egress packets, effectively isolating it.
t=09:02:53Z health=green   committed_docs=2605500   # brief stall
t=09:03:04Z health=yellow  committed_docs=2606100   # node declared gone, replica promoted
t=09:03:26Z health=yellow  committed_docs=2675600   # indexing resumed on healthy nodes
After a brief stall, Elasticsearch declared data-1 gone, promoted its replicas, and the cluster went yellow while indexing resumed on the healthy nodes. When the loss cleared, the node rejoined and the cluster returned to green.
Result: green → yellow via replica promotion, indexing resumed on healthy nodes, 0 data loss.
Chaos#10: Network Packet Duplicate (50%)
Save as tests/10-data-net-duplicate.yaml:
apiVersion: chaos-mesh.org/v1alpha1
kind: NetworkChaos
metadata:
  name: es-data-net-duplicate
  namespace: chaos-mesh
spec:
  action: duplicate
  mode: all
  direction: to
  selector:
    pods:
      demo: [es-ha-cluster-data-1]
  duplicate:
    duplicate: "50"
    correlation: "50"
  duration: "60s"
What this chaos does: Duplicates 50% of a data node’s packets; TCP silently discards the duplicates.
Health stayed green and throughput was unaffected (committed_docs rose ~35,000 over the window at the usual rate) — packet duplication is transparent to TCP.
Result: No failover, no throughput impact, 0 data loss.
Chaos#11: Network Packet Corruption (50%)
Save as tests/11-data-net-corrupt.yaml:
apiVersion: chaos-mesh.org/v1alpha1
kind: NetworkChaos
metadata:
  name: es-data-net-corrupt
  namespace: chaos-mesh
spec:
  action: corrupt
  mode: all
  direction: to
  selector:
    pods:
      demo: [es-ha-cluster-data-1]
  corrupt:
    corrupt: "50"
    correlation: "50"
  duration: "60s"
What this chaos does: Corrupts 50% of a data node’s packets, forcing TCP retransmissions.
t=08:58:33Z health=green  committed_docs=2183100
t=08:59:15Z health=green  committed_docs=2195000   # near-stall
Like the 500 ms delay, corruption kept the cluster green but collapsed indexing throughput (committed_docs moved only from 2,183,100 to 2,195,000) as half the corrupted node’s packets had to be retransmitted. No failover was triggered and full speed returned when the chaos ended.
Result: No failover, throughput collapse while degraded, 0 data loss.
Chaos#12: Bandwidth Throttle (1 Mbps)
Save as tests/12-data-bandwidth.yaml:
apiVersion: chaos-mesh.org/v1alpha1
kind: NetworkChaos
metadata:
  name: es-data-bandwidth
  namespace: chaos-mesh
spec:
  action: bandwidth
  mode: all
  direction: to
  selector:
    pods:
      demo: [es-ha-cluster-data-1]
  bandwidth:
    rate: "1mbps"
    limit: 20971520
    buffer: 10000
  duration: "60s"
What this chaos does: Caps a data node’s egress at 1 Mbps.
Health stayed green and throughput was largely sustained (~3,000+ docs/s) — the small bulk payloads fit comfortably under the cap.
Result: No failover, throughput largely unaffected, 0 data loss.
Chaos#13: DNS Error
Save as tests/13-data-dns-error.yaml:
apiVersion: chaos-mesh.org/v1alpha1
kind: DNSChaos
metadata:
  name: es-data-dns-error
  namespace: chaos-mesh
spec:
  action: error
  mode: all
  patterns: ["*"]
  selector:
    pods:
      demo: [es-ha-cluster-data-1]
  duration: "60s"
What this chaos does: Makes every DNS lookup in a data node fail.
The cluster members already hold established connections to each other by IP, so failing new DNS lookups for 60 seconds had no effect — health stayed green and indexing continued at full rate.
Result: No failover, no impact, 0 data loss.
Chaos#14: CPU Stress (98%)
Save as tests/14-data-cpu.yaml:
apiVersion: chaos-mesh.org/v1alpha1
kind: StressChaos
metadata:
  name: es-data-cpu
  namespace: chaos-mesh
spec:
  mode: one
  selector:
    pods:
      demo: [es-ha-cluster-data-0]
  stressors:
    cpu:
      workers: 4
      load: 98
  duration: "60s"
What this chaos does: Pins a data node’s CPUs at ~98%.
Health stayed green and indexing held at ~3,600 docs / 10s — the JVM stayed responsive enough to keep up.
Result: No failover, negligible impact, 0 data loss.
Chaos#15: Memory Stress (below the limit)
Save as tests/15-data-mem.yaml:
apiVersion: chaos-mesh.org/v1alpha1
kind: StressChaos
metadata:
  name: es-data-mem
  namespace: chaos-mesh
spec:
  mode: one
  selector:
    pods:
      demo: [es-ha-cluster-data-0]
  stressors:
    memory:
      workers: 2
      size: "256MB"
  duration: "60s"
What this chaos does: Adds memory pressure without triggering an OOM.
No OOM, health stayed green (one transient yellow blip), indexing sustained.
Result: No failover, 0 data loss.
Chaos#16: Clock Skew (−600s)
Save as tests/16-data-clock.yaml:
apiVersion: chaos-mesh.org/v1alpha1
kind: TimeChaos
metadata:
  name: es-data-clock
  namespace: chaos-mesh
spec:
  mode: one
  selector:
    pods:
      demo: [es-ha-cluster-data-0]
  timeOffset: "-600s"
  duration: "60s"
What this chaos does: Shifts a data node’s clock back by 10 minutes.
Elasticsearch cluster coordination uses relative/monotonic timers, so a 10-minute wall-clock offset had no effect — health stayed green and indexing continued at ~3,500 docs / 10s.
Result: No failover, 0 data loss.
Chaos#17: IO Latency (500ms) on the Data Volume
Now we move to disk. Elasticsearch fsyncs its translog and merges segments on /usr/share/elasticsearch/data, so injecting IO latency there directly slows shard operations.
Save as tests/17-data-io-latency.yaml:
apiVersion: chaos-mesh.org/v1alpha1
kind: IOChaos
metadata:
  name: es-data-io-latency
  namespace: chaos-mesh
spec:
  action: latency
  mode: one
  selector:
    pods:
      demo: [es-ha-cluster-data-0]
  volumePath: /usr/share/elasticsearch/data
  path: "/usr/share/elasticsearch/data/**"
  delay: "500ms"
  percent: 100
  containerNames: ["elasticsearch"]
  duration: "60s"
What this chaos does: Adds 500 ms latency to every file operation on a data node’s volume.
t=09:08:46Z health=yellow  committed_docs=3681900
t=09:09:39Z health=yellow  committed_docs=3832800
Unlike the network delay (which kept the cluster green), the disk latency pushed the cluster to yellow: the slow node’s shards fell behind and Elasticsearch relocated/flagged their replicas. Indexing continued on the healthy nodes (committed_docs kept climbing), and the cluster returned to green after the chaos cleared.
Result: green → yellow (slow shards flagged), indexing continued, 0 data loss.
Chaos#18: IO Fault (EIO, 50%)
We inject EIO (I/O error, errno 5) into half of all file operations on a data node’s volume.
Save as tests/18-data-io-fault.yaml:
apiVersion: chaos-mesh.org/v1alpha1
kind: IOChaos
metadata:
  name: es-data-io-fault
  namespace: chaos-mesh
spec:
  action: fault
  mode: one
  selector:
    pods:
      demo: [es-ha-cluster-data-0]
  volumePath: /usr/share/elasticsearch/data
  path: "/usr/share/elasticsearch/data/**"
  errno: 5
  percent: 50
  containerNames: ["elasticsearch"]
  duration: "60s"
What this chaos does: Returns EIO from 50% of the data node’s disk operations, simulating a failing disk.
t=09:10:55Z health=yellow  committed_docs=4061200
t=09:11:48Z health=yellow  committed_docs=4231500
The disk errors caused shard failures on data-0; Elasticsearch promoted the replicas on the other data nodes and the cluster went yellow while indexing continued uninterrupted on the healthy copies (committed_docs climbed from 4.04M to 4.23M). This is the key advantage of Elasticsearch’s replica model over a single-primary database: a disk fault on one node is contained because a full copy of every shard already lives elsewhere.
Result: Disk faults contained by replica promotion, green → yellow → green, 0 data loss.
Chaos#19: IO Attribute Override (read-only permissions)
Save as tests/19-data-io-attr.yaml:
apiVersion: chaos-mesh.org/v1alpha1
kind: IOChaos
metadata:
  name: es-data-io-attr
  namespace: chaos-mesh
spec:
  action: attrOverride
  mode: one
  selector:
    pods:
      demo: [es-ha-cluster-data-0]
  volumePath: /usr/share/elasticsearch/data
  path: "/usr/share/elasticsearch/data/**"
  attr:
    perm: 292        # 0444 read-only
  percent: 100
  containerNames: ["elasticsearch"]
  duration: "60s"
What this chaos does: Forces the data node’s files to read-only, failing writes.
The read-only permissions failed writes on data-0, its shards went unassigned, and the cluster dropped to yellow — but indexing continued on the other nodes (committed_docs 4.45M → 4.65M). The node recovered once permissions were restored.
Result: green → yellow (writes failed on one node), indexing continued elsewhere, 0 data loss.
Chaos#20: IO Mistake (random zero-fill corruption)
Save as tests/20-data-io-mistake.yaml:
apiVersion: chaos-mesh.org/v1alpha1
kind: IOChaos
metadata:
  name: es-data-io-mistake
  namespace: chaos-mesh
spec:
  action: mistake
  mode: one
  selector:
    pods:
      demo: [es-ha-cluster-data-0]
  volumePath: /usr/share/elasticsearch/data
  path: "/usr/share/elasticsearch/data/**"
  mistake:
    filling: zero
    maxOccurrences: 1
    maxLength: 1
  percent: 50
  containerNames: ["elasticsearch"]
  duration: "60s"
What this chaos does: Occasionally replaces a byte of an I/O operation with a zero, simulating silent corruption.
The cluster went yellow and indexing continued (past 5.1M documents); Elasticsearch’s per-segment and translog checksums, combined with the intact replicas on the other nodes, kept the data safe.
A note on cumulative disk chaos. Running four back-to-back IO experiments (latency, EIO, read-only, corruption) against the same node (
data-0) restarted it six times and eventually left four replica shards unassigned — the cluster was stuck yellow rather than snapping back to green. This is a good reminder that repeated disk faults erode a node’s ability to hold shards. A clean pod restart plusPOST /_cluster/reroute?retry_failed=truecleared the failed-allocation state and the cluster returned to green — with no primary shards ever lost.
Result: green → yellow, checksums + replicas preserved data, 0 data loss.
Chaos#21: Full Cluster Kill (Cold-Start Recovery)
The ultimate test: kill all eight pods — masters, data, and ingest — at once and watch the cluster boot from cold. Recovery depends entirely on the translog and Lucene segments persisted on disk.
Save as tests/21-full-cluster-kill.yaml:
apiVersion: chaos-mesh.org/v1alpha1
kind: PodChaos
metadata:
  name: es-full-cluster-kill
  namespace: chaos-mesh
spec:
  action: pod-kill
  mode: all
  selector:
    namespaces: [demo]
    labelSelectors:
      "app.kubernetes.io/instance": "es-ha-cluster"
  gracePeriod: 0
What this chaos does: SIGKILLs every node in the cluster simultaneously.
We first recorded the document count, then killed everything:
➤ curl .../chaos-load/_count
chaos-load doc count before kill = 5188300

➤ kubectl apply -f tests/21-full-cluster-kill.yaml
RECOVERY_ELAPSED=29s first_health=yellow
Every pod restarted from cold (all RESTARTS reset to 0), the masters re-formed a quorum, and the cluster health API was answering again in ~29 seconds. Shard recovery then brought it from yellow to green. Finally, the moment of truth — comparing the document count after the cold start against the pre-kill baseline:
➤ curl .../chaos-load/_count?pretty
  "count" : 5188300,

➤ curl .../_cluster/health?pretty
  "status" : "green",
  "unassigned_shards" : 0,
  "active_shards_percent_as_number" : 100.0
Exactly 5,188,300 documents — identical to the count before the cluster was destroyed. Not a single acknowledged write was lost across a full-cluster cold start, and the cluster returned to green with 100% of shards allocated.
Result: Cold-start recovery in ~29s, back to green with 100% shards, doc count exact, 0 data loss.
Chaos Testing Results Summary
Test Results Overview
| # | Experiment | Failure Mode | Recovery / Re-election Time | Data Loss | Downtime | Notes |
|---|---|---|---|---|---|---|
| 1 | Kill Elected Master | Master pod SIGKILL | ~1s (re-election) | 0 | None (stayed green) | Quorum 2/3, data untouched |
| 2 | Kill Data Node (primary) | Data pod SIGKILL | ~4s (to green) | 0 | Brief yellow | Replica promoted to primary |
| 3 | OOMKill Data Node | Memory → OOM | ~16–20s (to green) | 0 | Yellow while down | exitCode 137, auto-restart |
| 4 | Kill ES Process (data) | Container SIGKILL | ~10s (to green) | 0 | Brief yellow | No new index failures |
| 5 | Data Node Pod Failure | Pod made unresponsive | Yellow for pause; green on return | 0 | ~50s yellow | Replica reallocation delayed by node_left timeout |
| 6 | Kill Ingest Node | Ingest pod SIGKILL | none | 0 | None (stayed green) | Ingest holds no shards |
| 7 | Network Partition Master | Master isolation | ~8s (re-election) | 0 | None (stayed green) | Isolated master stepped down, no split-brain |
| 8 | Network Delay 500ms | Latency on data node | none | 0 | Throughput collapse | ES replication is latency-sensitive |
| 9 | Network Packet Loss 100% | Data node isolation | Yellow, then resumed | 0 | Brief stall | Replica promotion kept index available |
| 10 | Network Duplicate 50% | Packet duplication | none | 0 | None | Transparent to TCP |
| 11 | Network Corruption 50% | Packet corruption | none | 0 | Throughput collapse | Retransmits stalled indexing, stayed green |
| 12 | Bandwidth Throttle 1Mbps | Rate limiting | none | 0 | None | Small payloads fit under cap |
| 13 | DNS Error | DNS resolution failure | none | 0 | None | Cached peer IPs |
| 14 | CPU Stress 98% | CPU saturation | none | 0 | None | JVM stayed responsive |
| 15 | Memory Stress 256MB | Memory pressure (no OOM) | none | 0 | None | Below limit |
| 16 | Clock Skew −600s | Wall-clock offset | none | 0 | None | Coordination uses monotonic timers |
| 17 | IO Latency 500ms | Disk latency on /data |
Yellow → green | 0 | Yellow while degraded | Slow shards flagged, replicas served |
| 18 | IO Fault EIO 50% | Disk I/O errors | Yellow → green | 0 | Yellow while degraded | Fault contained by replica promotion |
| 19 | IO Attr Override (RO) | Read-only file perms | Yellow → green | 0 | Yellow while degraded | Writes failed on one node only |
| 20 | IO Mistake (zero-fill) | Silent byte corruption | Yellow → green | 0 | Yellow while degraded | Checksums + replicas preserved data |
| 21 | Full Cluster Kill | All 8 pods SIGKILLed | ~29s (to reachable) | 0 | ~29s | Cold start, doc count exact, back to green |
Key Findings
Across all 21 experiments, not a single acknowledged document was lost — after the full-cluster cold start the index held exactly the same 5,188,300 documents it had before. That is the headline result: KubeDB-managed Elasticsearch never sacrifices acknowledged data.
Health-Color Behavior Is Your Availability Signal
Elasticsearch’s genius is graceful degradation, and the health color tells you exactly where you stand:
| Scenario | Health | What it means |
|---|---|---|
| Master failure (Chaos 1, 7) | stays green | Masters hold no data; re-election is invisible to shards |
| Ingest failure (Chaos 6) | stays green | No shards to move |
| Data node loss (Chaos 2–5, 9, 17–20) | green → yellow → green | Replica promoted; primaries always available |
| Red | never observed | No experiment ever lost a primary shard |
Because every shard had a replica on a different node, no single-node failure ever turned the cluster red — primaries were always available and every acknowledged write survived.
Chaos Test Categories
- Pod-level (Chaos 1–6, 21): Excellent. Master re-election is ~1s; data-node loss is covered by replica promotion (yellow, never red); a full cold start recovers in ~29s with an exact document count.
- Network (Chaos 7–13): The master quorum handles partitions cleanly (~8s re-election, no split-brain). Data nodes tolerate duplication, bandwidth caps and DNS errors, but latency and corruption are the ones to watch — they don’t fail over, they silently collapse indexing throughput while the cluster still reports green.
- Resource / Time (Chaos 14–16): No effect. CPU/memory pressure and a 10-minute clock skew were shrugged off.
- IO (Chaos 17–20): Every disk fault was contained to a single node and its shards, dropping the cluster to yellow while replicas served traffic. Cumulative disk abuse on one node can leave replicas unassigned, but a pod restart and a reroute restore green — and primaries are never lost.
Performance Metrics Summary in chaos cases
| Metric | Typical | Best | Worst |
|---|---|---|---|
| Master re-election | ~1–8s | ~1s (pod kill) | ~8s (partition) |
| Data-node recovery to green | ~4–20s | ~4s (pod kill) | ~50s (pod-failure, delayed reallocation) |
| Indexing throughput (steady) | ~2,600–3,100 docs/s | ~3,150 docs/s | near-0 (delay/corruption) |
| Acknowledged-write data loss | 0% | 0% | 0% |
| Full cold-start recovery | ~29s | — | — |
| Node fault tolerance (3 data, 1 replica) | 1 node | — | red only if a primary+replica pair are lost together |
Conclusion
The KubeDB-managed Elasticsearch topology cluster demonstrates excellent resilience across all 21 failure scenarios. Master re-election completes in seconds and never touches your data; data-node failures are absorbed by replica promotion, moving the cluster through yellow and back to green without losing a single acknowledged write; and even a full cold start recovers with an exact document count.
The trade-offs to respect are Elasticsearch-specific. Yellow is not an emergency — it means “fully available, temporarily less redundant” — but sustained yellow means you are one failure away from data risk, so watch it. Network latency and packet corruption are the silent killers: they throttle indexing without tripping a failover, so alert on throughput, not just health color. And because a 3-data-node cluster with one replica tolerates only one node at a time, size your replica count and node count to your real failure budget — add replicas and pair the cluster with regular backups for correlated-failure protection. With those in place, KubeDB gives you an Elasticsearch deployment that degrades gracefully and keeps your data safe.
What Next?
Please try the latest release and give us your valuable feedback.
-
If you want to install KubeDB, please follow the installation instructions from here .
-
If you want to upgrade KubeDB from a previous version, please follow the upgrade instructions from here .
Support
To speak with us, please leave a message on our website .
To receive product announcements, follow us on Twitter .
If you have found a bug with KubeDB or want to request new features, please file an issue .